 Google Analytics has been our go-to for understanding how visitors get to your site, what they read, what they interact with, and much more.
As we’ve shared, the next generation of Analytics is launching this summer (July 1st, 2023), called Google Analytics 4 (GA4).
To help you prepare, we’ve provided a basic overview of GA4 and links to more resources for supporting your website through this change.
Before you go any further, make sure you’ve read through the first resource in this series, then dig in here. There is a lot to know about GA4 but you need to learn it in the right order so it all make sense. Make sure you dive into all of the resources in this series…in order.
GA 4 Resource Series
- #1: GA4 – What You Need to Know
- #2: GA4 Basics + Reporting <— You are here
- #3: Conversion Tracking with GA4
- #4: How to find AdRotate Stats in GA4
- #5: Using UTM Codes For Tracking
- #6: VIDEO: Using Behavior Flow To Set Goals
What is Google Analytics 4 (GA4)?
In short, GA4 is Google’s new type of website analytics designed for the future of measurement that will collect event-based data from both websites and apps.
GA4 is entirely based on events (an event is defined as any interaction a visitor takes on your website other than pageviews) to make insights about app and web engagement simpler.
This is done by connecting your Google ads and social media accounts to get a clear picture of your engagement from all channels.
GA4 “Tour”
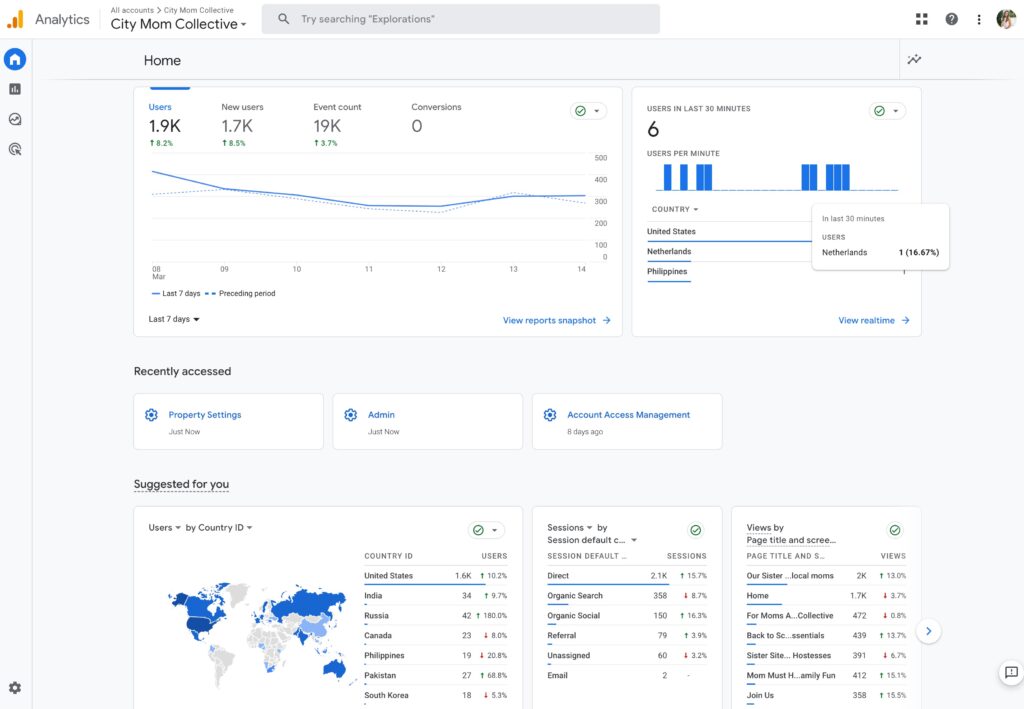
New HOME Screen
Below is a screenshot of what you can expect your GA4 HOME Screen to look like.
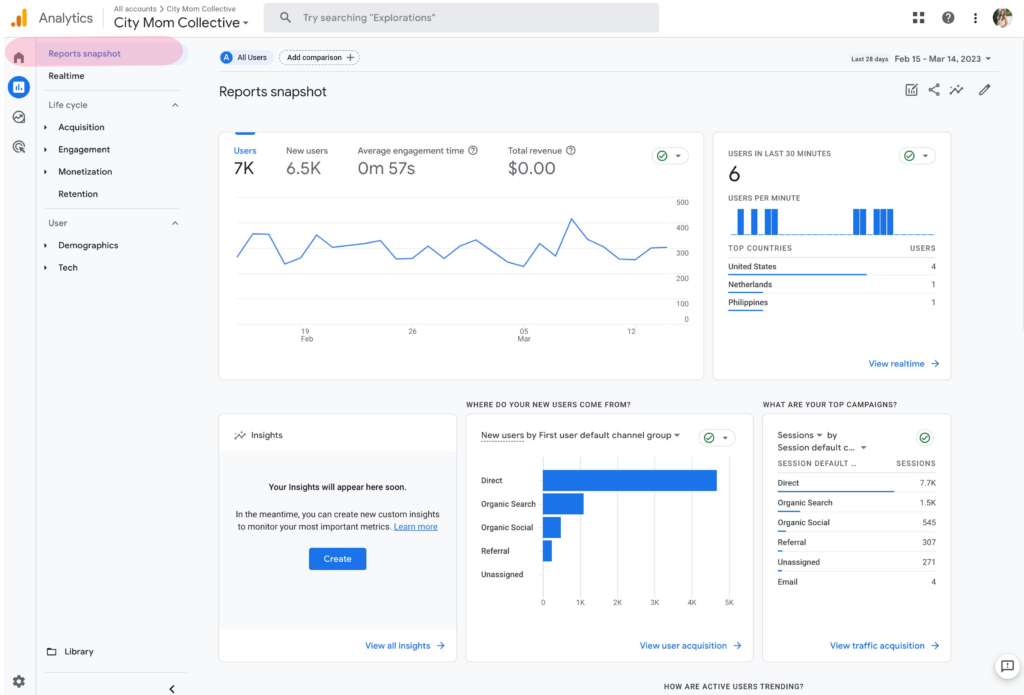
GA4 Dashboard
To access your GA4 Dashboard Reports, go to reports on the left-hand side of GA4. This will lead you to the reports dashboard where you will find snapshots of different reports. The snapshots will differ depending on the metrics most important for your website. You can find acquisition, engagement, monetization, and overview. This will give you more detailed insights.
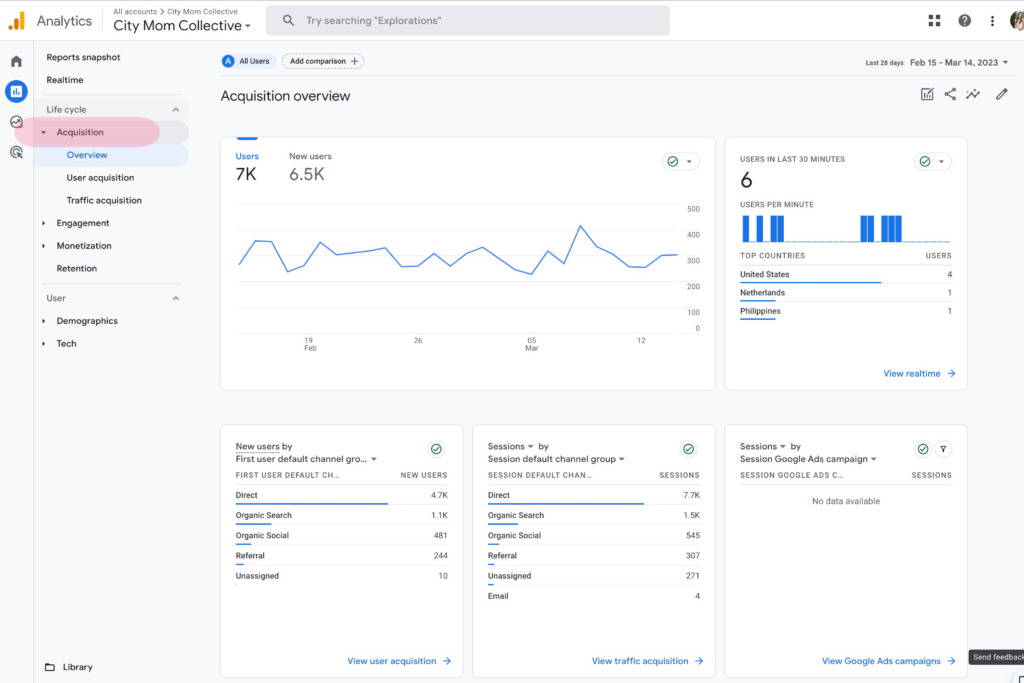
Acquisition
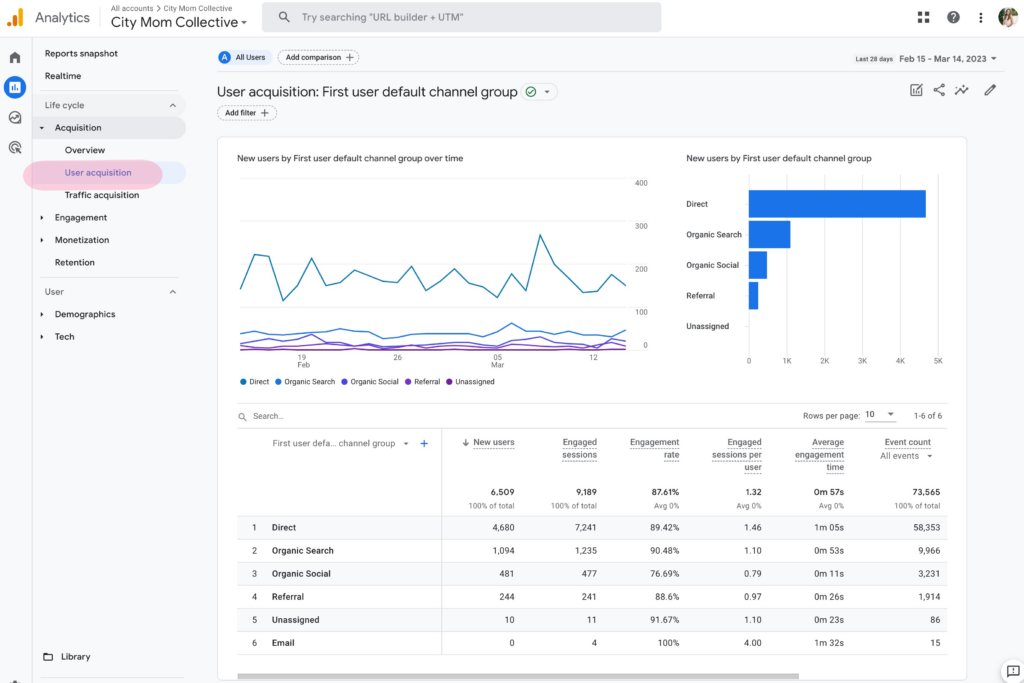
On the left sidebar, you’ll see Acquisition. This portion of your GA4 reporting gives you a breakdown of where your visitors are coming from. Under Overview you can find a wide range of widgets. Many of the widgets have links that will provide a more detailed view of the data. User acquisition and Traffic acquisition give details on which channels users are taking to get to your site. This helps you get a perspective on which channels you should be investing in.
Acquisition > Overview
Acquisition > User Acquisition
Engagement
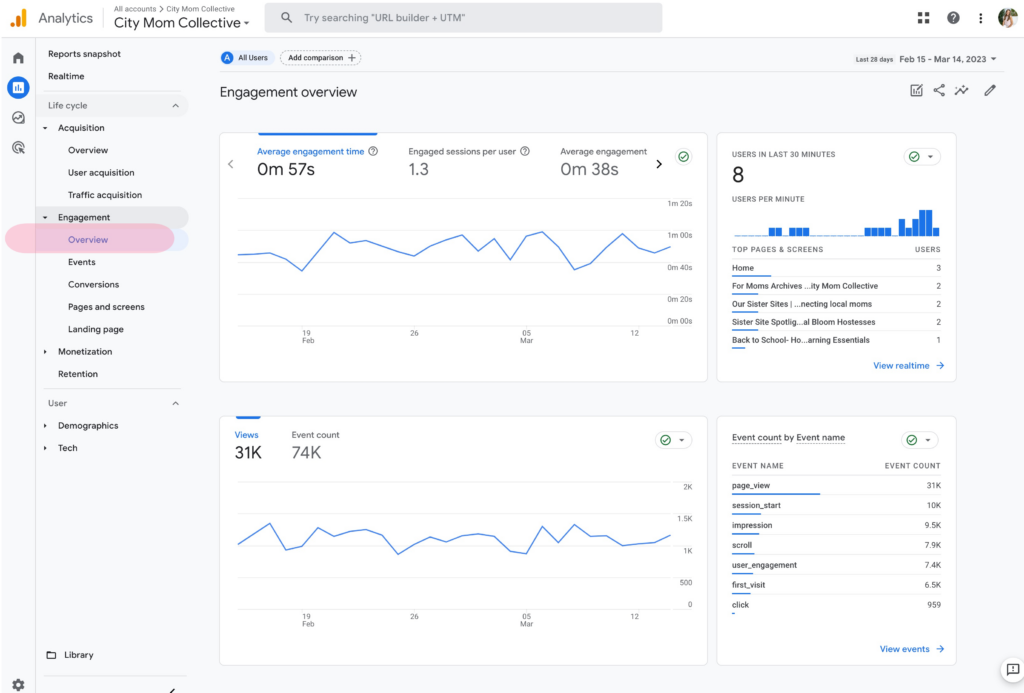
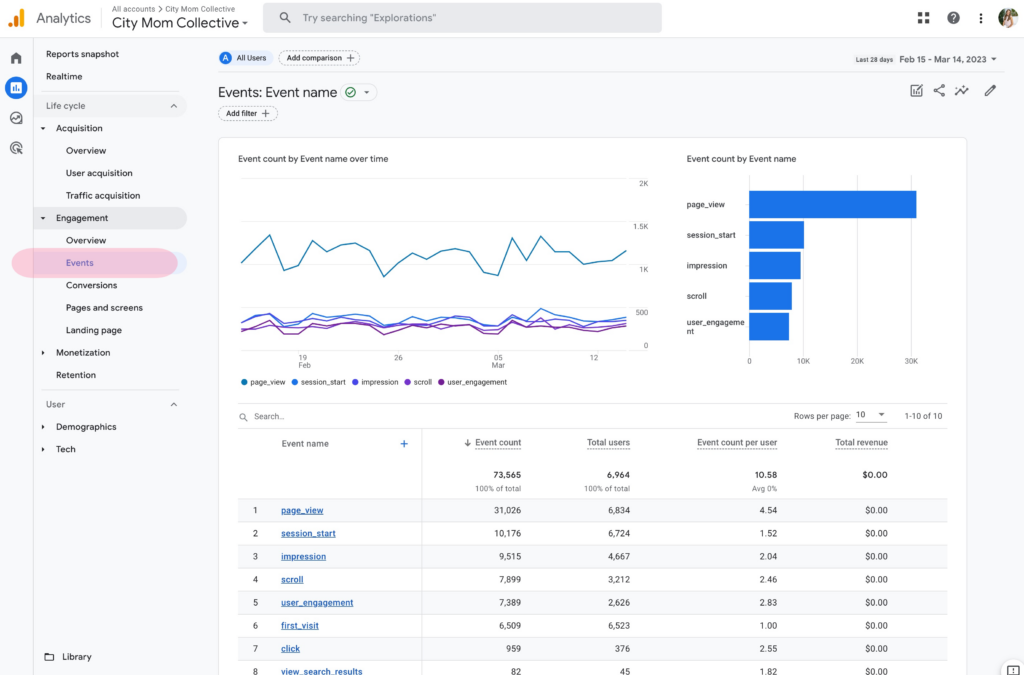
On the left sidebar, you’ll see Engagement under Acquisition. This portion of your GA4 report will give insight into the user engagement on your site. The Overview section has a number of widgets providing engagement information, such as views and users per minute. It also contains widgets with information such as average engagement time, users, and user activity over time. Under Events you can find event count by event name. Under Conversions, you can find conversion by event name stats.
Engagement > Overview
Engagement > Events
Monetization
On the left sidebar, you’ll also see a Monetization option. This provides insight into revenue. In Overview you can find revenue from e-commerce purchases made on your site as well as ad revenue. You can also find more detailed information such as purchased items and user revenue. Depending on the format of your site, this may or may not be helpful. Under e-commerce purchases, you can find your e-commerce sales by item name.
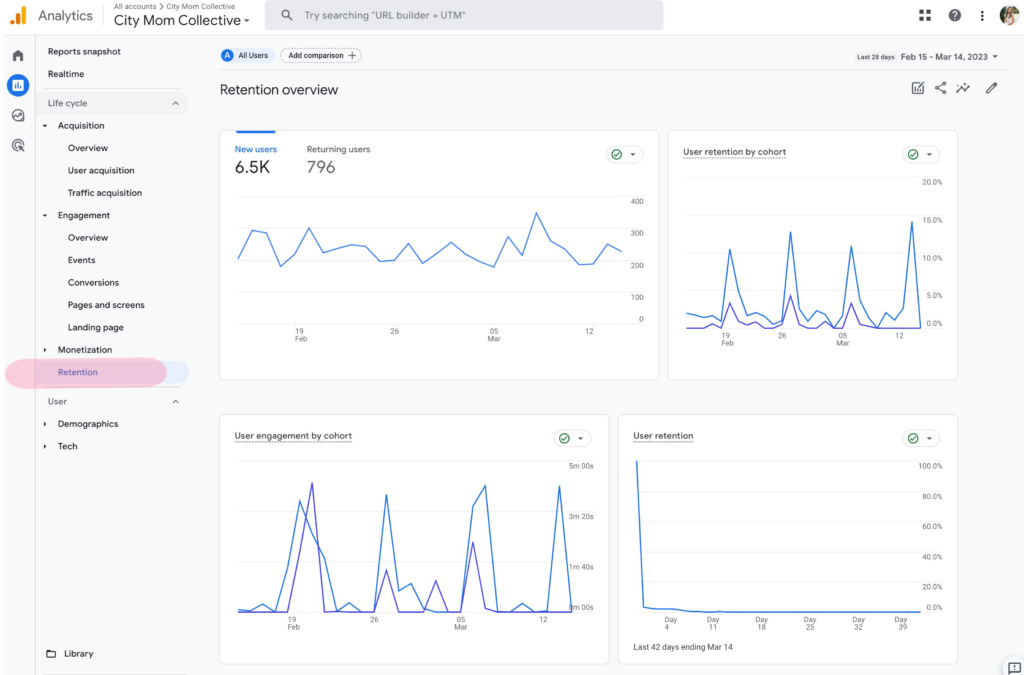
Retention
On the left sidebar, you’ll also see a Retention option. This section gives insight into the retention overview. You will find new vs. returning users, user engagement, or lifetime value information.
New Metrics in GA4
Below you’ll find a basic overview of the primary metrics in GA4.
Active Users
This is the new primary user metric In GA4. This measures users in engaged sessions when someone is on a page on your site for at least ten seconds.
Pageviews
This metric tracks the number of times a page on a website is viewed. Pageviews provide valuable insights into the most popular pages and can help you optimize your website based on user behavior.
Sessions
This is a group of user events in a given time period. A session ends after 30 minutes of inactivity from a user.
Conversions
Conversion Rate is a metric that tracks the percentage of users who complete a desired action on a website, such as making a purchase or filling out a contact form.
Bounce Rate
Bounce Rate is a metric that measures the percentage of users who leave a website after viewing only one page. This metric can help you identify areas where users are not engaging with your website.
Event Count
Event Count is a metric that tracks the number of events that occur on a website, such as button clicks, video views, and file downloads. This metric can help you optimize your website based on which events are most important to your business goals.
GA4 Reporting Options
The reporting options available for GA4 differ significantly from what is available in Universal Analytics.
For this reason, as City Mom Collective Premium Members, you will have two options for reporting available.
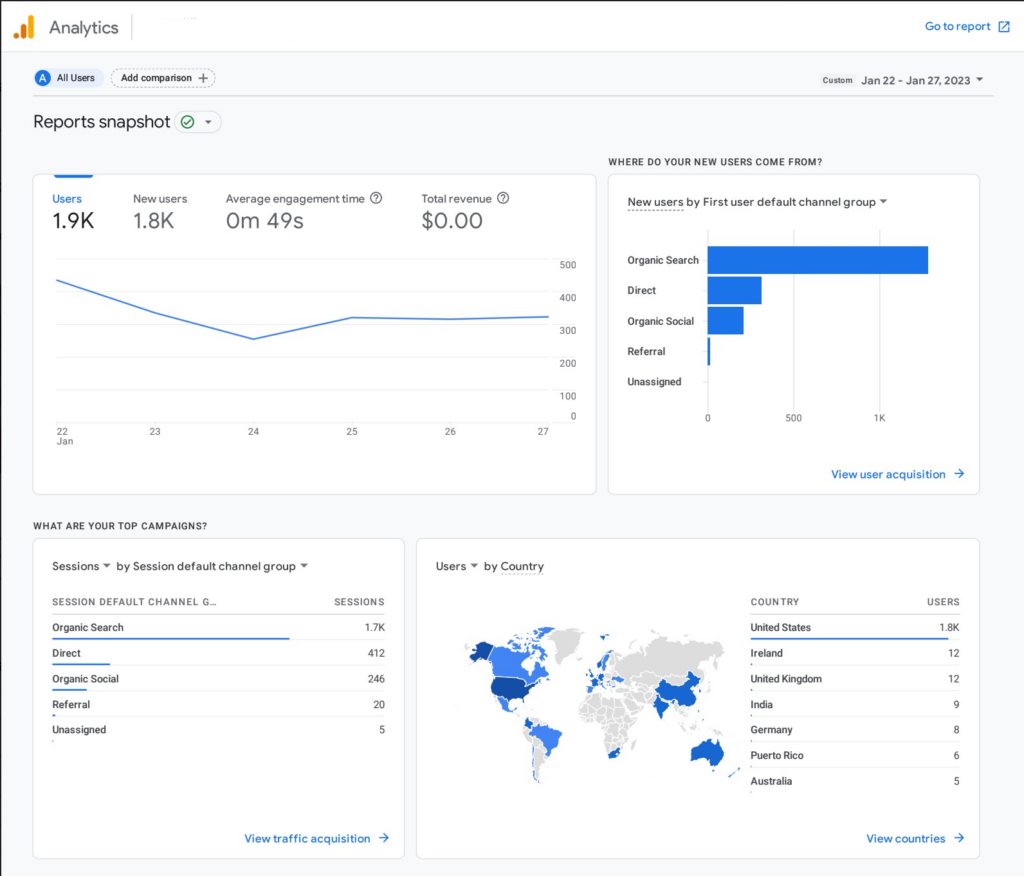
(1) Free Report from GA4
Below is a screenshot of the GA4 Free Report that all Premium Members will receive starting in July 2023.
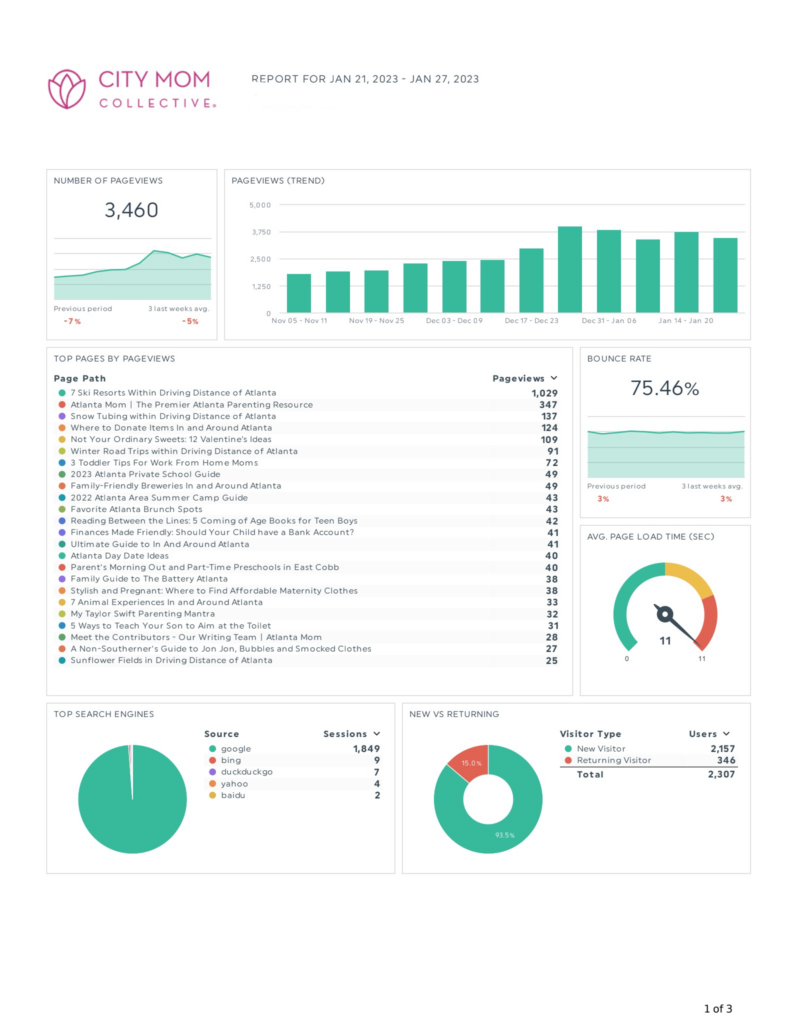
(2) Paid Enhanced Report (Cost is $16/month)
Because the free GA4 Report is quite basic, we have spent months researching an alternative option for your analytics needs. We know this is essential to your content creation strategy and sponsor communication.
Below is a screenshot of what an Enhanced GA4 Report would look like.
It’s important to note that the Enhanced Report is more user-friendly (in our minds) and can include social integrations and Google Ads and Mailchimp data.
Note: The $16/month price is a bulk license rate we were able to secure as a network meaning that it is cheaper than what you’d get if you were to purchase the reporting on your own.
If you would like to sign-up for a new Enhanced Report, please submit the form below.
Oops! We could not locate your form.